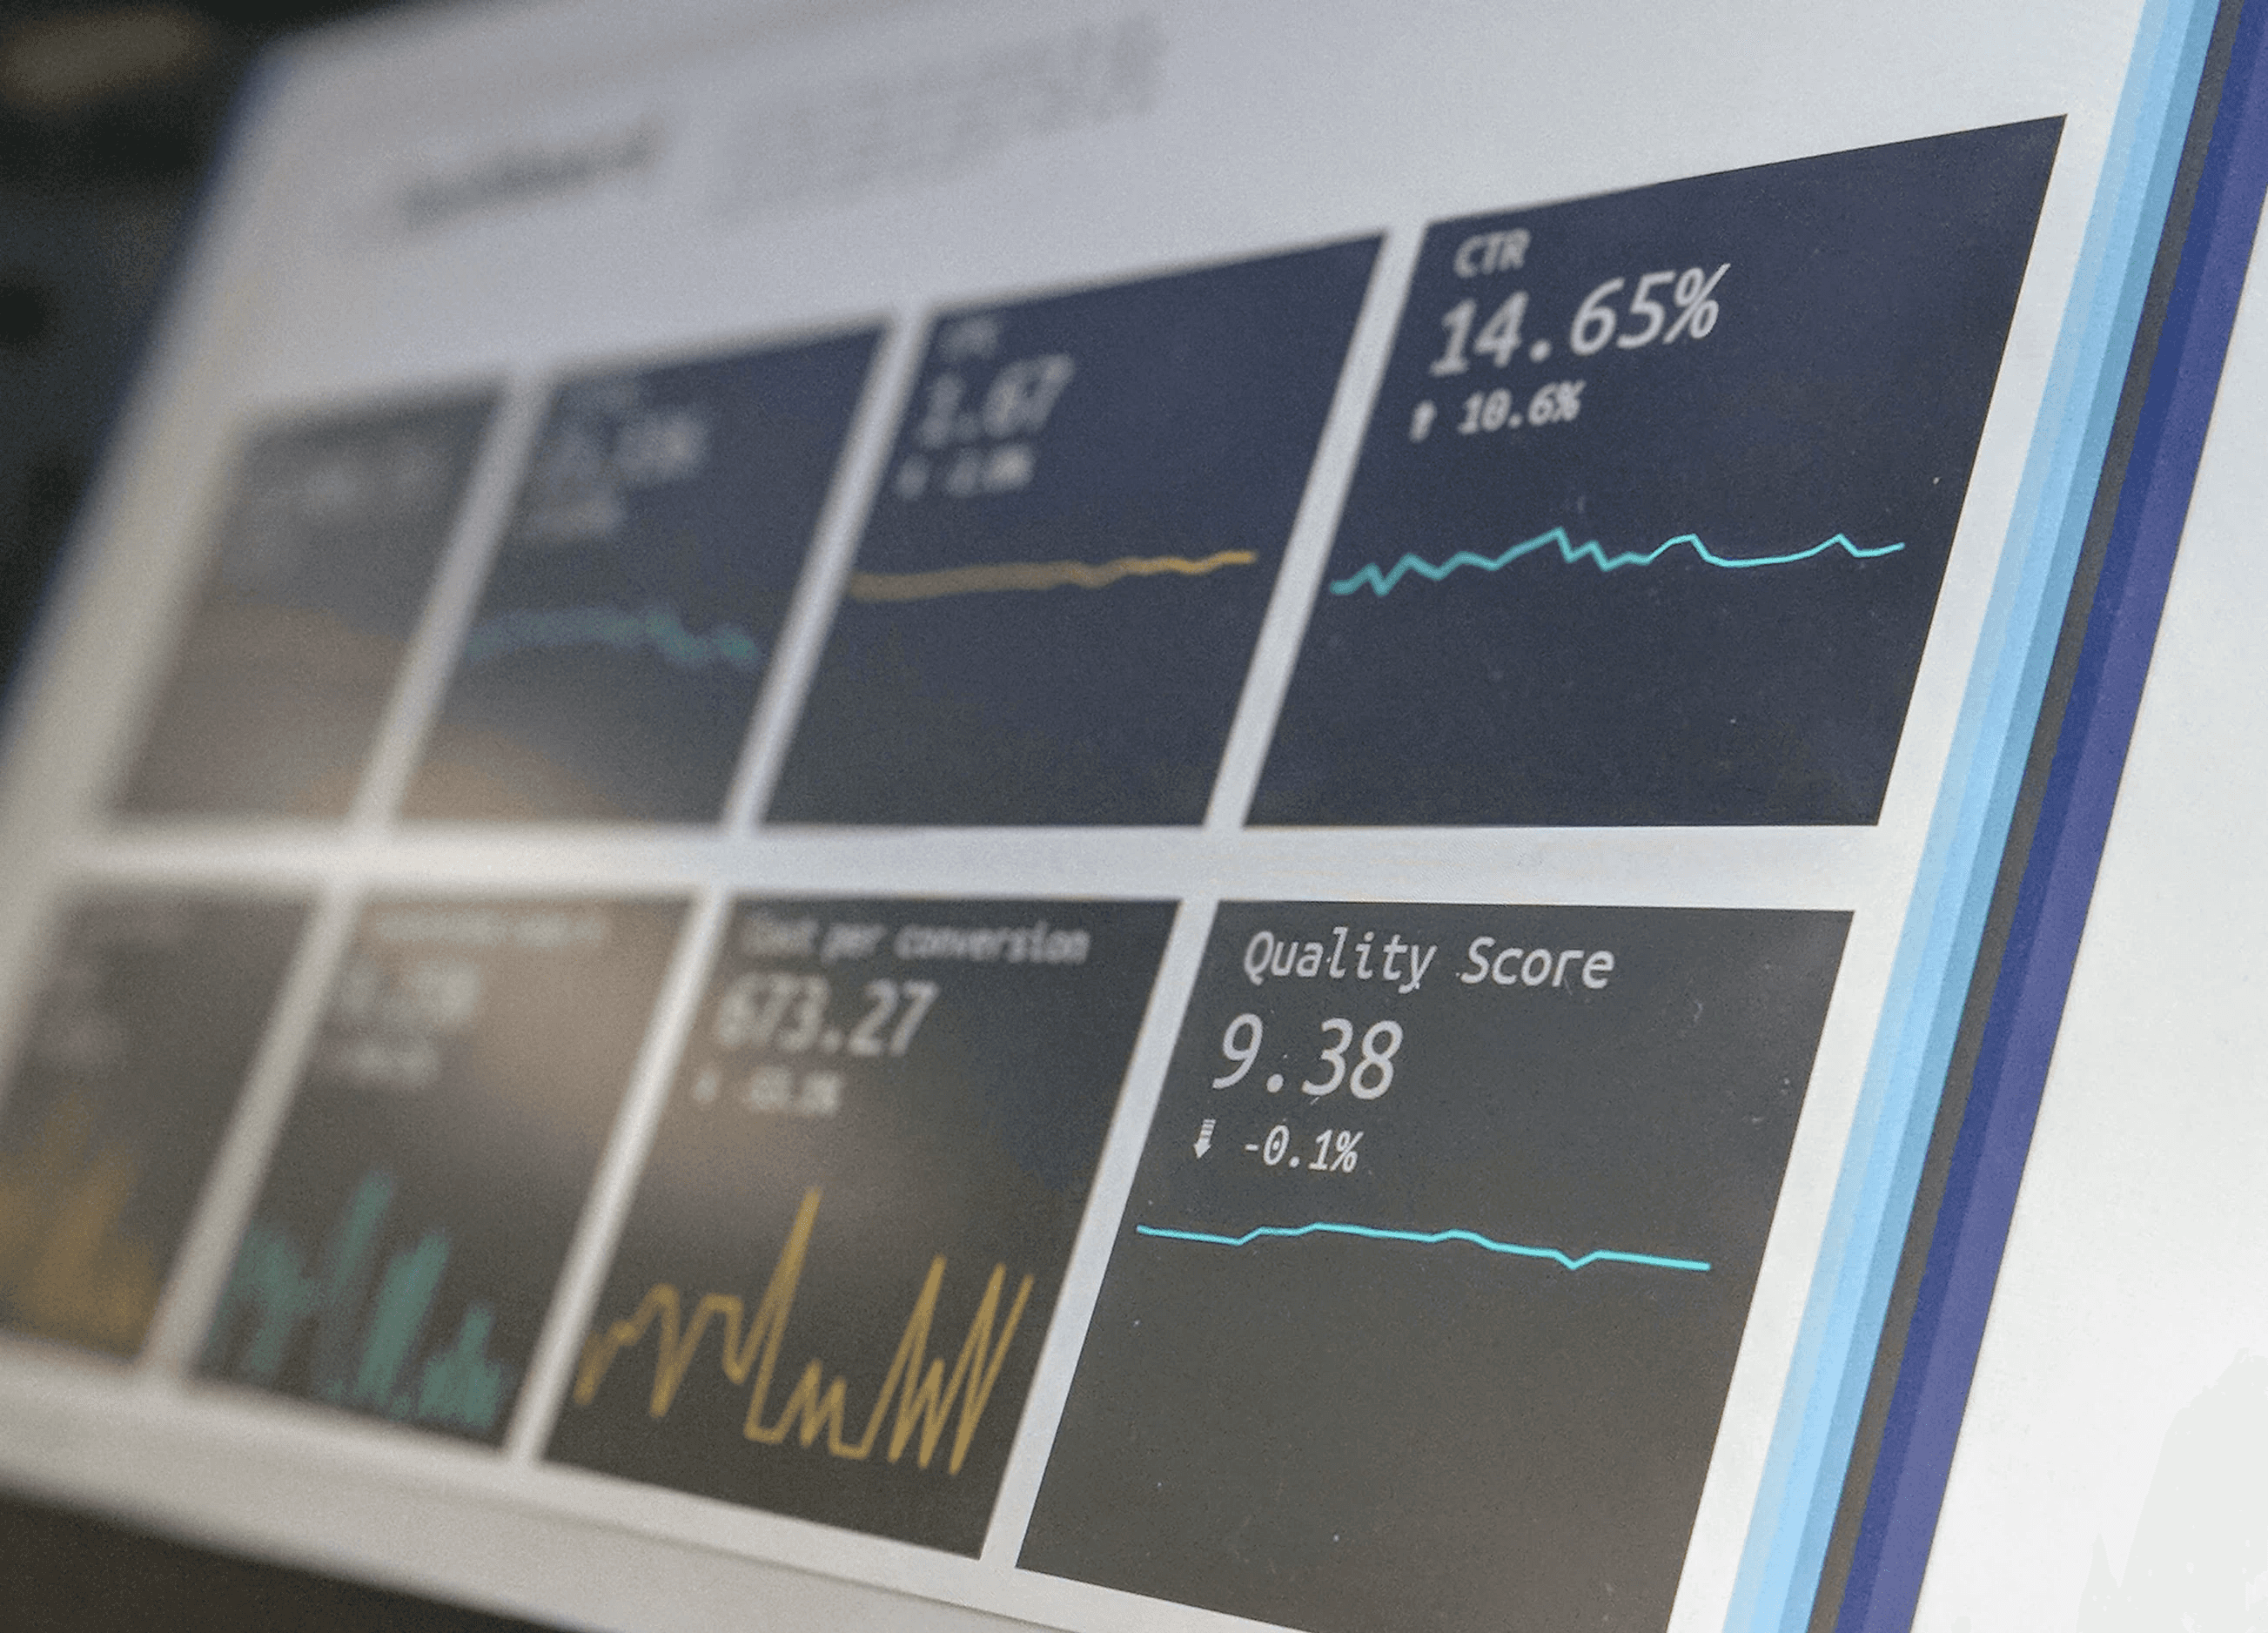
Time-series data of computational clusters
Time-series data of computational clusters, such as those in Kubernetes environments, capture a dynamic stream of information detailing the performance metrics, resource utilization, and operational behaviors of the cluster. These data sequences provide valuable insights into cluster activities over time, revealing patterns, trends, and irregularities that might otherwise remain uncovered.
Anomaly detection systems may harness the power of machine learning to thoroughly analyze complex time-series data, swiftly identifying outliers and enabling proactive responses to potential issues. This way Ops teams can make informed decisions and take action before any problems arise, optimize resource allocation, ensure high availability, and guarantee uninterrupted operation of computational clusters.
Anomaly detection in time-series data is typically formulated as the identification of outlier data points that deviate from the expected or normal signal. Here are some examples of outlier types:
1. Point anomaly
A single data point that is significantly different from the surrounding data points, often referred to as "strange points" or "outliers".
2. Contextual anomaly
Sequences of numbers within a time series that might not appear unusual in isolation, but become anomalies due to unexpected patterns when compared to historical data.
3. Collective anomalies
Involve multivariate patterns that do not seem strange individually, but collectively give a sense that something is unusual in the dataset.
4. Concept drift
Refers to a gradual and consistent shift towards a new state, which might itself be an anomaly warranting detection. This phenomenon can be described as an unusual or unexpected drift.
5. Change Point Detection
Detect abrupt shifts ("change points") in time series. Flag these significant changes and maintain flags until a new normal pattern emerges. Often seen as sudden and unusual steps in the data.
6. Seasonality
Characterized by a regular, repetitive pattern in data that follows a consistent time interval. For instance, sales data commonly displays seasonality, with peaks occurring during holiday seasons and specific times of the year.


